
Spectroscopy is “the study of investigation and measurement of the absorption and emission of light or electromagnetic radiation by matter as a function of its wavelength and frequency”[8]. In simple terms, it’s the study of the interaction of light with a matter or substance.
Depending on the nature of the interaction between the energy and material, spectroscopy is divided into subcategories that include: Absorption spectroscopy, emission spectroscopy, elastic scattering and reflection spectroscopy, impedance spectroscopy, resonance spectroscopy, and nuclear spectroscopy[13].
Spectroscopy is also subdivided depending on the type of radiative energy and the type of interacting material.
In this article, the principle, workings, and applications of protein NMR spectroscopy are discussed. However, before jumping to that, let’s briefly take a look at the basics of NMR spectroscopy.
Nuclear magnetic resonance (NMR) spectroscopy techniques are used to study the molecular structure of chemical compounds by exploiting the magnetic field around their atomic nuclei. This is done by determining the different local electronic environments of atoms like hydrogen, carbon, chlorine, etc in a chemical compound.
It is the only method that produces the 3-D structure of the molecule in the solution phase. The occurring electromagnetic resonance phenomenon provides detailed information about the structure, dynamics, reaction state, and chemical environment of molecules, like protein.
You may read more about the terms, advantages, and disadvantages of NMR spectroscopy in the article “Nuclear Magnetic Resonance Spectroscopy.”
The NMR spectroscopy works on the principle of change in the energy state and orientation of an atomic nuclei in a magnetic field. The change depends on the presence or absence of electrons around the atomic nuclei of a molecule.
This phenomenon brings all atomic nuclei in the same direction and this is called resonance state. And, the transfer of energy and the state of atomic nuclei is shown by the different levels of signals on the screen.
Further, the signals of the NMR spectra are processed and the amount of energy required to bring the atomic nuclei in the higher state is calculated. Multiple machines are required to yield the structure of the molecule in the solution.
The formula to calculate the required amount of energy to bring the atomic nuclei to its higher state is:
𝚫E = hv
Where = change in energy
h = Planck’s constant
v = frequency of light
The NMR operating frequency is calculated[4]:
v = ( 𝜸 / 2π ) * Bo
Where 𝜸 = Gyromagnetic ratio which differs in different nuclei
Bo = the magnetic field strength applied by NMR
This equation signifies that the higher the frequency of the light, the higher will be the applied strength of the magnetic field. So, the frequency is directly proportional to the applied magnetic field strength.
The resonance spectra are obtained by the chemical shifts of nuclei. Different atomic nuclei show different chemical shifts due to the shielding effect of electrons surrounding them in the presence of magnetic fields. This causes the nuclei to resonate at slightly different frequencies.
The formula[4] used to calculate this: v = ( 𝜸 / 2π ) * Bo * (1-𝛔)
Here 𝛔 is the shielding effect.
NMR spectroscopy has unfolded many mysteries of the molecule behaviors. Protein NMR spectroscopy help to study the changes in protein conformation, denaturation, and internal mobility, pH titration of individual ionizable amino acid side chains in enzyme active sites, observation of hydrogen-bonded imino protons in tRNA, investigation of paramagnetic centers in metalloproteins, etc[1].
This method measures the short distances and angles between different protons and then computationally the protein structure is derived. The modern spectroscopy of proteins requires multidimensional experiments that involve 1H, 13C, and 15N nuclei in isotopically labeled proteins[1].
The NMR spectroscopy machine consists of nine major parts, sample holders, magnetic coils, a permanent magnet, sweep generator, radiofrequency transmitter, radiofrequency, RF detector, recorder, and readout system. These all parts orchestrate their functions to yield the desired results.
The different steps of determining the protein structure include: Sample preparation, NMR measurements, Resonance assignments, and Structure determination from the NMR data. The steps are discussed below.
Some points should be kept in mind before the sample preparation. It helps to remove the impurities and reduce the background noise while experimentation.

Figure: NMR sample protein preparation in a thin-walled tube[13]
To determine the structure of the protein, in which thousands of resonances will be present, a 1-dimensional 1H NMR spectrum becomes overlapping and crowded. So, to avoid this confusion, a 2-D or 3-D NMR experiment is preferred to gather the required information.
The 2-D and 3-D NMR experiments spread out the spectra along two and three frequency axes. The spectra represent some “cross-peaks” in which the signal of the spectrum is equal on both sides of a diagonal.
The cross-peaks are formed due to the transfer of magnetization and it shows that the two atomic nuclei are coupled and have different chemical shifts. The shift is so small that it is defined in parts per million (ppm). (You can refer to the article 1H NMR chemical shift to learn more about the chemical shifts during NMR experiments)
The detected signal frequency is proportional to the externally applied magnetic field. However, the external magnetization is also disturbed and opposed by the response of external electrons. This change in the effective magnetic field causes the shift in the nucleus spin frequency. This is called the “chemical shift”[10].
So, the effective magnetic field that spins the nucleus is calculated by using the formula:
Beffective= Bapplied— Blocal
Beffective = the magnetic field that affects nuclei.
Bapplied =the externally applied magnetic field by NMR.
Blocal = the local magnetic field applied by the electrons that surround the atomic nuclei.
The most important information is gathered by Nuclear Overhauser Enhancement (NOE) spectroscopy or NOESY. It helps in determining the orientation of the atoms in a molecule. When the distance between the two protons is approximately 5.0 Ao then a cross peak is observed between two hydrogen atoms.
So, the NOESY experiment depends on through-space distance. In different 2-D NMR experiments that support the 1H- NMR assignment, the cross peak signifies the through-bond relationship between protons. This means that the protons are not separated by more than three covalent bonds and they are part of the same amino acid.
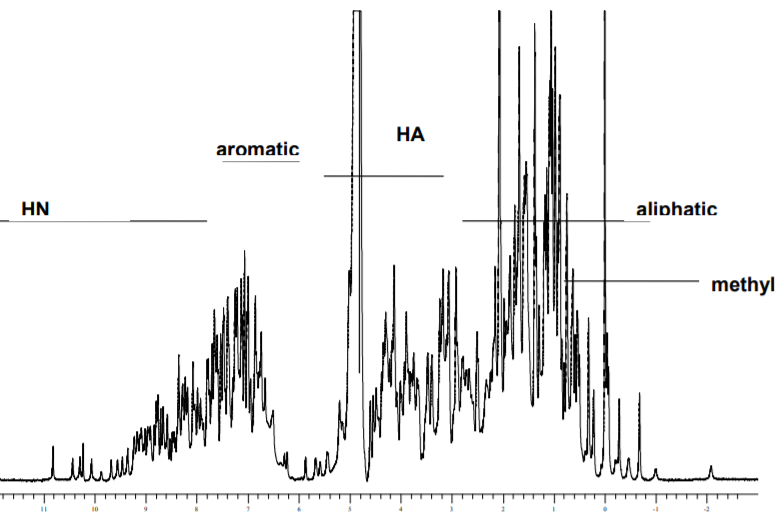
Figure: 1H-NMR spectrum of lysozyme[11].
In this step, the peaks observed (chemical shifts) in the spectrum are assigned to specific atoms. Resonance assignments help in characterizing the structure and dynamics of the protein by specifying the atomic identities of unique frequencies in the spectrum[3]. But, a protein contains multiple residues of amino acids and that produce thousand of signal peaks in the spectra.
This confusion is resolved by using the sequential assignment strategy[3]. This method is based on the prior knowledge of the sequence of the amino acid and involves the use of (homonuclear) 1H- NMR experiments. The traditional methods include the heteronuclear or triple resonance approach.
The 1H- NMR method follows three steps[9] for the resonance assignment:

To derive the structure of the protein, the three restraints need to be determined. It includes distance restraints, angle restraints, and orientation restraints. The distance restraint is determined by the NOESY experiment and to read the cross-peaks several software are used such as PASD, XPLOR-NIH, CYANA, and UNIO.
The resonance assignments can be a cumbersome process if done manually. The use of software algorithms make the process quick and smooth, and also ensures efficient NOESY spectral analysis.
The angle restraints, like psi (𝝍) and phi (𝝓) angles, are determined by using the Karplus equation or using chemical shift spectra. So, a calculation of both, coupling constants and chemical shift, the torsion angles of the molecule can be determined.
After the determination of all the structural restraints, chemical shifts, and resonance assignment the structure of the protein is determined using the data. The obtained data, help the researchers to identify the local helical structures, beta-sheets, and tight turns in the amino acid sequence. The secondary structure obtained is used as a model, or computational methods are used for the interpretation of the tertiary structure of the protein.
The current methods that are used to calculate the structure from NMR data include, initial metric matrix distance geometry followed by molecular dynamics calculations and variable target function algorithm supplemented by molecular mechanics energy minimization[1].
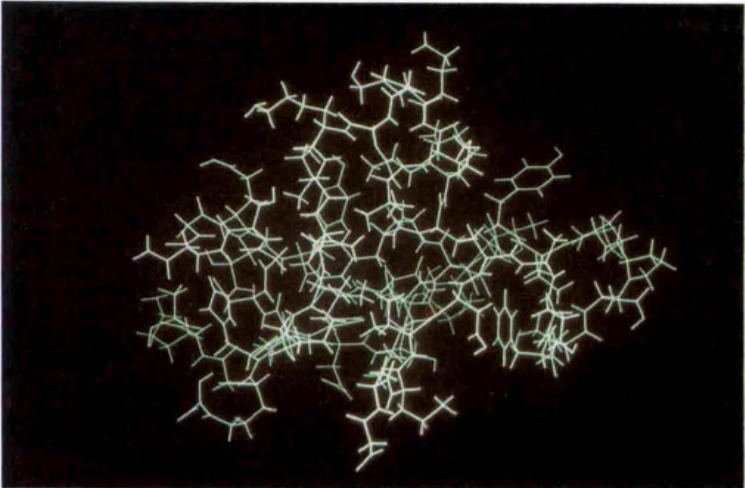
Figure: The first structure of a globular protein, named bull seminal proteinase inhibitor IIA (BUSI IIA), is determined by using NMR spectroscopy in solution.
Source: Wuthrich Kurt (1990). Protein structure determination in solution by NMR spectroscopy. The Journal of Biological Chemistry, 265 (36), 22059-22062
The process of the determination of the structure of large proteins, that weighs around 25 kDa, is complex and an efficient structure cannot be obtained by only using NMR spectroscopy[6].
A large number of resonances, increase in linewidths, and poor signal to noise ratio causes the crowding and overlapping of the spectra. So, the advanced isotopic labeling and multidimensional experiments proved to help resolve the issue[12].
The latest developments have introduced a couple of techniques that help in the attenuation of the magnetization relaxation and refine protein structure[11]. These techniques are transverse relaxation optimized spectroscopy (TROSY) and deuteration.
Nuclear Magnetic Resonance (NMR) Spectroscopy is a powerful technique that is widely used in several chemical and biochemical labs.
The limitation of the method is that it can only determine the structure of proteins that weighs about 12,000. NMR spectroscopy doesn’t yield efficient and readable spectra for larger proteins for about 13000-15000.
So, the advancement in multidimensional spectroscopy experiments and isotopic labeling can pave the way for better insights into protein structure and its functioning.
Also, improvements in the software algorithms will be helpful to smoothen the cumbersome process of resonance assignment and designing the molecular structure.
Get the entire package for up to 50% discount with our Replication program.
DISCLAIMER: ConductScience and affiliate products are NOT designed for human consumption, testing, or clinical utilization. They are designed for pre-clinical utilization only. Customers purchasing apparatus for the purposes of scientific research or veterinary care affirm adherence to applicable regulatory bodies for the country in which their research or care is conducted.